All content on this site is intended for healthcare professionals only. By acknowledging this message and accessing the information on this website you are confirming that you are a Healthcare Professional. If you are a patient or carer, please visit the MPN Advocates Network.
The mpn Hub website uses a third-party service provided by Google that dynamically translates web content. Translations are machine generated, so may not be an exact or complete translation, and the mpn Hub cannot guarantee the accuracy of translated content. The mpn and its employees will not be liable for any direct, indirect, or consequential damages (even if foreseeable) resulting from use of the Google Translate feature. For further support with Google Translate, visit Google Translate Help.
The MPN Hub is an independent medical education platform, sponsored by AOP Health, GSK, Sumitomo Pharma, and supported through educational grants from Bristol Myers Squibb and Incyte. Funders are allowed no direct influence on our content. The levels of sponsorship listed are reflective of the amount of funding given. View funders.
Now you can support HCPs in making informed decisions for their patients
Your contribution helps us continuously deliver expertly curated content to HCPs worldwide. You will also have the opportunity to make a content suggestion for consideration and receive updates on the impact contributions are making to our content.
Find out more
Create an account and access these new features:
Bookmark content to read later
Select your specific areas of interest
View MPN content recommended for you
Characteristics of gut microbiota in patients with PV and the impact of different treatments
Do you know... Eickhardt-Dalbøge et al.1 investigated gut microbiota composition in patients with PV. Which of the following statements about alpha diversity in gut microbiota is true in patients with PV versus healthy controls?
Most patients with polycythemia vera (PV) have a Janus kinase-2 (JAK-2) driver mutation, with 3% and 96% of patients carrying them in Exon 12 and 14 (JAK2V617F), respectively. The inflammatory JAK2V617F mutation may lead to the development and progression of myeloproliferative neoplasms (MPN).1
Currently, there is limited understanding of the gut microbiota in patients with MPN and how it compares with healthy individuals. Changes in the gut microbiota are associated with several autoimmune and inflammation-driven diseases, such as MPN, and can influence responses to immunotherapy and hematopoiesis; therefore, further understanding of the gut microbiota in patients with MPN is important.
Recently published in Blood Advances, a study by Eickhardt-Dalbøge et al.1 investigated the characteristics of gut microbiota in a series of patients with PV versus healthy controls (HCs) and the impact of different treatment regimens. Here, we summarize the key findings.
Methods
This cohort study included patients with PV aged >18 years and HCs who had no JAK2V617F or CALR mutations, no elevated blood cell counts, and a high-sensitivity C-reactive protein ≤2 mg/L.
Fecal samples subjected to amplicon-based next-generation sequencing of the V3-V4 regions of the 16S rRNA gene were used to characterize the gut microbiota. Clinical, biochemical, and comorbidity data were then collected.
Results
Baseline characteristics
A total of 102 patients with PV and 42 HCs were included, with a median age of 70 and 71 years, respectively. Baseline characteristics were well balanced between patients in both cohorts, with the exception of a lower median thrombocyte count (227 × 109/L vs 309 × 109/L; p < 0.0001) and a higher mean hematocrit (mean, 43% vs 42%; p = 0.037) in HCs versus patients with PV, respectively.
According to treatment received, patients were classified as: no treatment (NT), hydroxyurea (HU), recombinant interferon alfa 2 (IFN-α2), and ruxolitinib plus IFN-α2 in lower doses (COMBI). Comparisons of treatment groups and HCs showed significant differences for selected baseline characteristics, as shown in Table 1, with p-values ranging from 0.001 to 0.01.
Table 1. Baseline characteristics*
|
COMBI, ruxolitinib plus IFN-α2 in lower doses, eGFR, estimated glomerular filtration rate; HC, healthy control; HU, hydroxyurea; IFN-α2, recombinant interferon alfa 2; NT, no cytoreductive treatment. |
||||||
|
Characteristics |
NT (A) |
HU (B) |
COMBI (C) |
IFN-α2 (D) |
HCs (E) |
p value |
|---|---|---|---|---|---|---|
|
Median age (range), years |
62 (38–79) |
74 (53–85) |
68 (47–79) |
65 (31–81) |
71 (66–74) |
E vs A, p = 0.002; |
|
Median duration of treatment (range), weeks |
― |
210 (13–1028) |
47 (13–369) |
186 (35–587) |
― |
C vs B + D, p < 0.01 |
|
Median leucocyte count (range), ×109/L |
8.5 (5.2–20.0) |
6.7 (2.9–21.8) |
4.6 (2.9–7.3) |
4.1 (2.5–13.2) |
6.2 (4.5–9.4) |
A vs C + D + E, p < 0.001; |
|
Mean hematocrit, % |
44 |
42 |
38 |
42 |
43 |
A vs C, p < 0.001; |
|
Median thrombocyte count (109/L), (range) |
415 (147–884) |
316 (120–635) |
288 (118–494) |
206 (113–820) |
227 (125–355) |
A vs C, p = 0.03; A vs D, p < 0.01; |
|
Mean eGFR (SD), n |
83.8 (18.4) |
72.8 (12.2) |
75.2 (15.3) |
85.1 (12.2) |
73.1 (13.2) |
B vs D, p = 0.02 |
Patients with PV have lower alpha diversity
Patients with PV showed significantly lower gut microbiota alpha diversity compared with HCs (p = 0.016). In contrast, patients with PV showed a higher observed richness of amplicon sequence variants per sample versus HCs (median observed amplicon sequence variants, 209.5 vs 190; p = 0.034). Patients treated with COMBI and those receiving NT demonstrated lower alpha diversity compared with HCs (median Inverse Simpson Index, 18.8 and 19.4 vs 26.3, respectively). However, the differences were not statistically significant after adjusting for multiple testing.
Patients with PV have lower abundance of taxa within Firmicutes
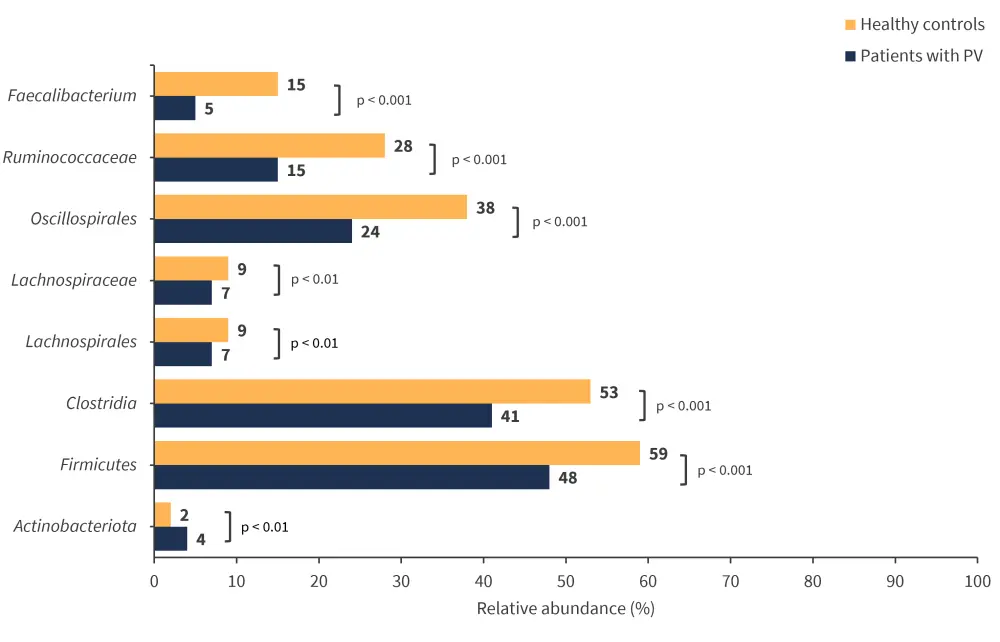
Overall bacterial composition did not differ between the two cohorts; however, heat tree analysis showed lower abundances of taxa associated with the phylum Firmicutes and Prevotellaceae in patients with PV compared with HCs. On the contrary, a higher abundance of Bacteroides was observed in patients with PV. Differential abundance analysis revealed 13 taxa that significantly differed between patients with PV and HCs (Figure 1).
Figure 1. Differential abundance of gut microbiota in PV and HCs*

PV, polycythemia vera.
*Adapted from Eickhardt-Dalbøge, et al.1
Variation in relative abundance of gut microbiota in different PV treatment groups
Principal coordinate analyses revealed no significant differences in overall gut bacterial composition. However, differential abundance analysis showed:
- Higher abundance of Firmicutes, particularly Oscillospirales and Clostridia in IFN-α2 versus NT group (54% vs 43%; p = 0.039).
- Higher abundance of Bacteroides in NT vs IFN-α2 group (40% vs 14%; p < 0.01) and NT vs HU group (40% vs 24%; p = 0.033).
- Higher abundance of Bacteroides in COMBI vs IFN-α2 group (33% vs 14%; p < 0.01).
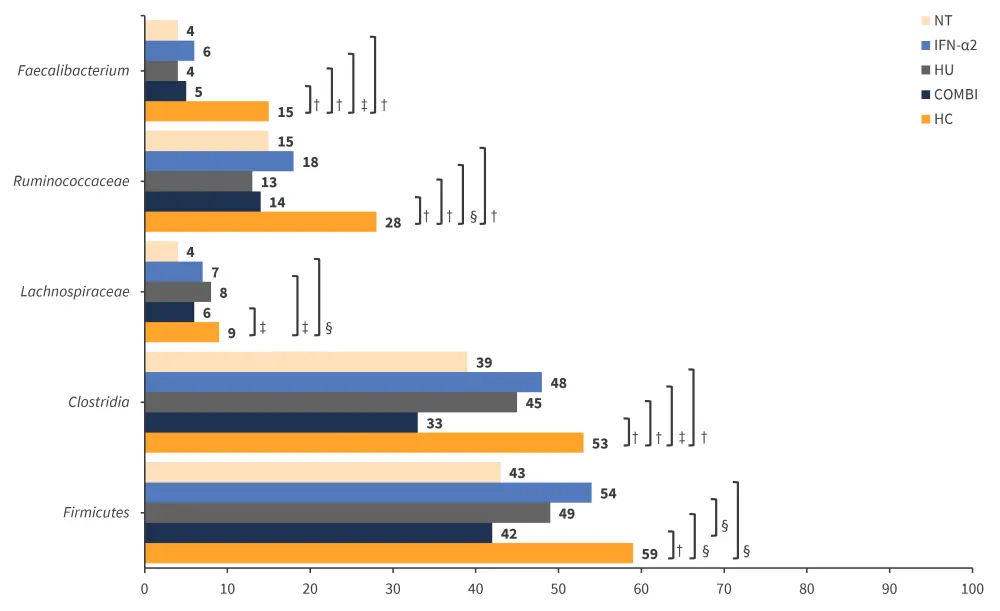
- Lower abundance of Firmicutes in COMBI vs IFN-α2 group (42% vs 54%; p < 0.01), particularly Clostridia (33% vs 48%; p = 0.034) and Ruminococcaceae (14% vs 18%, p = 0.049).
Variation in composition and relative abundance of gut microbiota in different PV treatment groups versus HCs
In terms of gut bacterial composition, all PV treatment groups differed significantly when compared with HCs; NT vs HCs (p = 0.001), HU vs HCs (p = 0.001), IFN-α2 vs HCs (p = 0.002), and COMBI vs HCs (p = 0.001). Differential abundance analysis revealed:
- A significantly higher abundance of Firmicutes was observed in HCs (59%) compared with patients with PV in the NT group (43%; p < 0.01), COMBI (42%; p < 0.001), or HU (49%, p < 0.01) groups.
- Within this phylum, HCs showed higher abundance of Clostridia, Ruminococcaceae and Faecalibacterium compared with different PV treatment groups (Figure 2).
- Several Bacteroides taxa had a higher abundance in NT vs HCs (40% vs 20%; p < 0.01) and COMBI vs HCs (33% vs 20%; p < 0.01).
- However, HCs had a higher abundance of Prevotellaceae (4%) compared with NT (0%), COMBI (0%), HU (0%), and IFN-α2 group (1%; p < 0.05).
Figure 2. Differential abundance in all treatment groups and HCs*

COMBI, ruxolitinib plus IFN-α2 in lower doses; HC, healthy control; HU, hydroxyurea; IFN-α2, recombinant interferon alfa 2; NT, no cytoreductive treatment.
*Adapted from Eickhardt-Dalbøge, et al.1
†p < 0.001.
‡p < 0.05.
§p < 0.01.
Conclusion
This study demonstrated that the characteristic gut microbiota of patients with PV featured a lower abundance of Firmicutes compared with HCs. Differences in gut microbiota among different PV treatment groups were also seen. Interestingly, the gut microbiota of the IFN-α2-treated group appeared to be more comparable to that of HCs. However, further research is needed to explore whether these variations were due to IFN-α2 treatment or whether certain microbiota boosted IFN-α2 response. Also, this study was limited by a small sample size and variations in the start of treatment and when stool samples were taken.
References
Please indicate your level of agreement with the following statements:
The content was clear and easy to understand
The content addressed the learning objectives
The content was relevant to my practice
I will change my clinical practice as a result of this content

