All content on this site is intended for healthcare professionals only. By acknowledging this message and accessing the information on this website you are confirming that you are a Healthcare Professional. If you are a patient or carer, please visit the MPN Advocates Network.
The mpn Hub website uses a third-party service provided by Google that dynamically translates web content. Translations are machine generated, so may not be an exact or complete translation, and the mpn Hub cannot guarantee the accuracy of translated content. The mpn and its employees will not be liable for any direct, indirect, or consequential damages (even if foreseeable) resulting from use of the Google Translate feature. For further support with Google Translate, visit Google Translate Help.
The MPN Hub is an independent medical education platform, sponsored by AOP Health, GSK, Sumitomo Pharma, and supported through educational grants from Bristol Myers Squibb and Incyte. Funders are allowed no direct influence on our content. The levels of sponsorship listed are reflective of the amount of funding given. View funders.
Now you can support HCPs in making informed decisions for their patients
Your contribution helps us continuously deliver expertly curated content to HCPs worldwide. You will also have the opportunity to make a content suggestion for consideration and receive updates on the impact contributions are making to our content.
Find out more
Create an account and access these new features:
Bookmark content to read later
Select your specific areas of interest
View MPN content recommended for you
Comparing responses of pegylated interferon-alfa and hydroxyurea in patients with ET and PV
Essential thrombocytopenia (ET) and polycythemia vera (PV) are myeloproliferative neoplasms (MPN) that commonly present with high-risk thrombotic events or progression to myelofibrosis (MF). To combat thrombotic events, treatment consists usually of a cytoreductive agent which is either pegylated interferon-alfa-2a (PEG) or hydroxyurea (HU). Despite the frequent real-world use of these agents, a comparison of clinical and hematologic responses is lacking, and could provide insight into the optimal therapy within these disease subtypes.
Results from a phase III trial, comparing PEG and HU in patients with high-risk ET and PV, were recently published by Mascarenhas et al.1 in Blood. We summarize key results below.
Methods
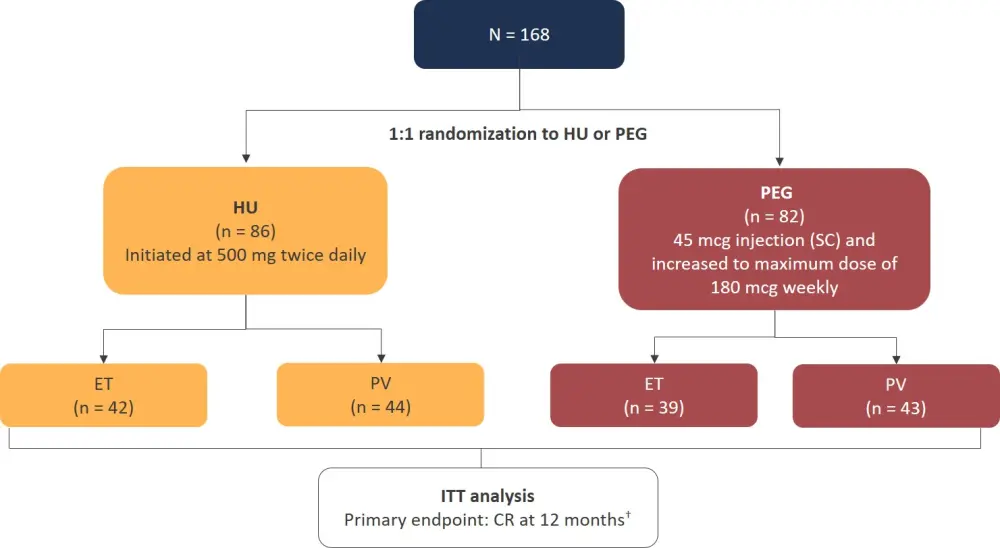
The MPD-RC 112 trial (NCT01259856) was a randomized phase III trial conducted at 24 centers in North America and Europe.
The eligibility criteria for this study included:
- Diagnosis of ET or PV according to the 2008 World Health Organization (WHO) criteria
- High-risk disease defined by one of the following:
- History of thrombosis
- Age >60 years
- History of bleeding (ET only)
- Platelet count >1,500 × 109/L in ET, and >1,000 × 109/L in PV
- Vasomotor symptoms (erythromelalgia, severe migraine headaches)
- Significant or symptomatic splenomegaly
- The presence of diabetes or hypertension requiring pharmacologic intervention
Figure 1. Study design*

CR, complete response; ET, essential thrombocytopenia; HU, hydroxyurea; ITT, intention-to-treat; PEG, pegylated interferon-alfa-2a; PV, polycythemia vera; SC, subcutaneous.
*Adapted from Mascarenhas et al.1
†CR was defined as a platelet count <400 × 109/L, hematocrit control (<45% without phlebotomy for PV patients only), white blood cell count of <10 × 109/L, resolution of splenomegaly, and resolution of disease-related symptoms (microvascular disturbances, headache, and pruritus).
Results
Patient characteristics are summarized in Table 1.
Table 1. Patient characteristics*
|
ECOG, Eastern Cooperative Oncology Group performance status; ET, essential thrombocytopenia; HU, hydroxyurea; MPN, myeloproliferative neoplasms; PEG, pegylated interferon-alfa-2a; PV, polycythemia vera. |
||
|
Characteristic |
HU |
PEG |
|---|---|---|
|
Median age, years (range) |
63 (18–87) |
60 (19–79) |
|
Female, % |
44 |
40 |
|
MPN subtype, % |
||
|
ET |
49 |
48 |
|
PV |
51 |
52 |
|
ECOG performance score, % |
||
|
0 |
84 |
79 |
|
1 |
15 |
18 |
|
2+ |
1 |
2 |
|
Driver mutation, % of patients |
||
|
JAK2V617F |
92 |
89 |
|
CALR |
5 |
10 |
|
MPL |
4 |
3 |
|
Cytogenetic abnormalities, % |
20 |
11 |
|
Median hemoglobin, g/dL (range) |
14.3 (11.3–16.4) |
14.6 (8.4–16.6) |
|
Median leukocyte count, × 109/L (range) |
9.2 (3.0–34.4) |
8.6 (4.0–24.8) |
|
Median platelet count, × 109L (range) |
612 (112–1,444) |
602 (112–1,662) |
|
Median hematocrit, % (range) |
43.1 (40–70.2) |
43.8 (40–61.9) |
|
History of thrombosis, % |
23 |
32 |
Clinical response
12 months
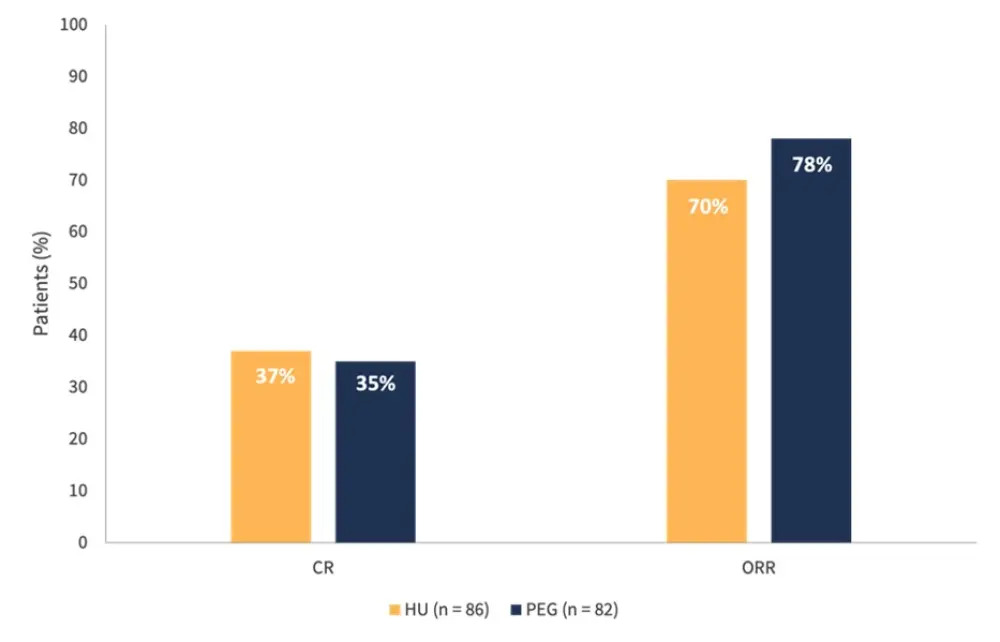
- There was no significant difference in complete response (CR) and overall response rate (ORR) at 12 months between the treatment arms (Figure 2).
Figure 2. CR and ORR at 12 months*

CR, complete response; HU, hydroxyurea; ORR, overall response rate; PEG, pegylated interferon-alfa-2a.
*Adapted from Mascarenhas et al.1
- When comparing CR within disease subtypes, no significant difference was reported in patients with ET receiving HU or PEG (45% and 44%, respectively)
- Likewise, no difference in ORR was reported between the two treatment types (71% in the HU cohort, 69% in the PEG cohort)
- In patients with PV, no significant difference in CR was observed (30% in the HU cohort, and 28% with PEG)
- ORR was greater in those receiving PEG compared with HU (86% vs 68%, respectively)
- Other notable differences regarding symptoms included greater hematocrit control in patients with PV receiving PEG (65% vs 43% receiving HU; p = 0.04)
- Notably, there appeared to be a dose effect of HU on the achievement of CR with a higher median weekly dose in patients with CR compared with those without CR: 6,995 mg (IQR, 5,567–7,678) and 5,804 mg (IQR, 3,884–7,000); p = 0.03
- This was not observed in patients receiving PEG
24 and 36 months
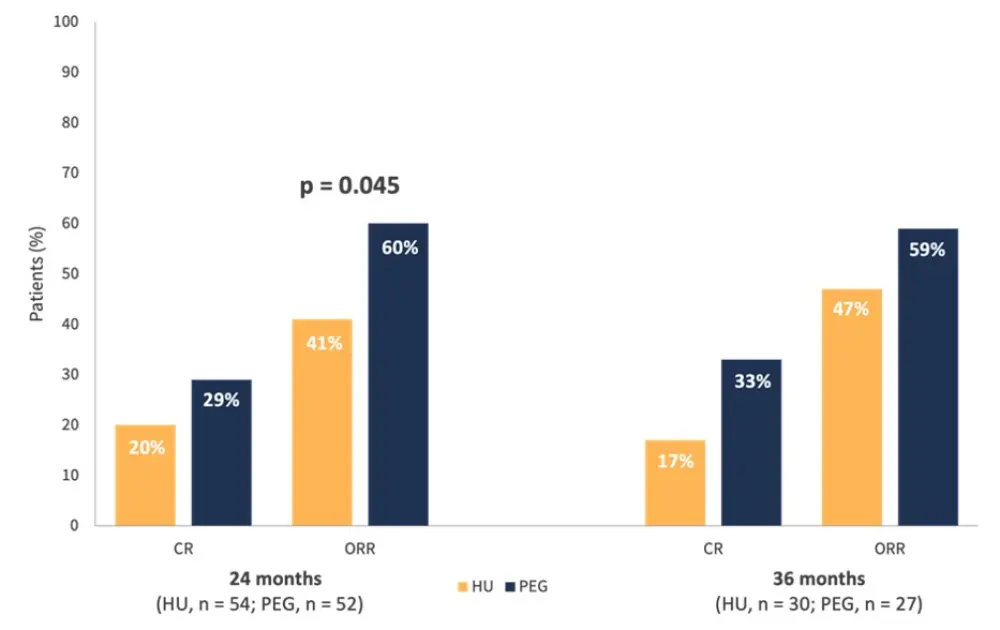
- After 24 months, there was a significant difference reported in ORR; however, CR was similar between the treatment groups (Figure 3)
- At 36 months, both CR and ORR were comparable for those receiving HU and PEG
Figure 3. CR and ORR at 24 and 36 months*

CR, complete response; HU, hydroxyurea; ORR, overall response rate; PEG, pegylated interferon-alfa-2a.
*Adapted from Mascarenhas et al.1
In the HU arm, median spleen reduction was −5% vs −6% in the PEG arm. In terms of thrombotic events and progression, there were five events including a bleeding event of macroscopic hematuria, cerebral vascular accident in the PEG arm, bilateral vertebral artery blockage, and progression to MF in the HU arm. Cumulative incidence of thrombosis at 24 months was 2% in both arms.
In 109 evaluable patients, HU produced a greater histopathologic response (HPR, 23%) than PEG (5%; p = 0.01).
- The rate of best HPR was greater in the HU arm (33% vs 17% in the PEG arm; p = 0.05)
- A HPR was more frequently observed in patients with ET compared with PV after 12 months (24% and 6%, respectively)
- Patients with ET also more frequently achieved best HPR (42% vs 12%)
- There was a dose dependent effect observed with HU on achieving HPR (p = 0.04) which was not observed with PEG.
Cytogenetic and molecular response
- Cytogenetic responses included loss of a chromosomal abnormality, loss of Y and del(16q) with no association between cytogenetic response and CR/PR
- The authors highlighted a reduction in JAK2V617F variant allele frequency (VAF) in most patients on HU or PEG treatment
- When comparing the median greatest change from baseline in JAK2V617F, HU treatment was −5.3% compared to −10.7% with PEG
- Notably, the median JAK2V617F VAF had a consistent reduction after 24 months in the PEG arm which was significantly greater than that observed in the HU arm: −0.16 (95% CI, −0.23, −0.10) vs −0.004 (95% CI, −0.08, 0.08), respectively; p = 0.002
- Both treatments also resulted in a reduction of CALR and TET2 VAFs
Safety
- A total of 162 patients were assessed for adverse events (AEs) during treatment, and 60 patients (37%) experienced a Grade ≥3 AE
- Notably, Grade ≥3 AEs were more common with PEG treatment compared to HU: 46% vs 28%, respectively; p = 0.01 (Table 2)
Table 2. Grade 3–4 AEs reported in HU and PEG treatment arms*
|
AE, adverse event; HU, hydroxyurea; PEG, pegylated interferon-alfa-2a. |
||
|
Grade 3–4 AE, % |
HU |
PEG |
|---|---|---|
|
Hematologic |
||
|
Neutropenia |
4 |
2 |
|
Lymphopenia |
1 |
4 |
|
Thrombocytopenia |
1 |
0 |
|
Anemia |
0 |
1 |
|
Nonhematologic |
||
|
Peripheral sensory neuropathy |
4 |
0 |
|
Urinary tract infection |
4 |
0 |
|
Fatigue |
3 |
7 |
|
Hypertension |
3 |
7 |
|
Back pain |
3 |
1 |
|
Hyperglycemia |
1 |
2 |
|
Alanine aminotransferase increased |
1 |
2 |
|
Diarrhea |
1 |
0 |
|
Abdominal pain |
1 |
0 |
|
Mucositis oral |
1 |
0 |
|
Headache |
0 |
4 |
|
Flu-like symptoms |
0 |
2 |
|
Pruritus |
0 |
2 |
|
Dyspnea |
0 |
2 |
|
Pain in extremity |
3 |
1 |
|
Maculopapular rash |
0 |
1 |
Conclusion
In the study, the rates of thrombotic events and MF progression were low in both treatment arms. Overall, HU and PEG demonstrated comparable cytoreductive activity after 12 months in patients with ET and PV. In the longer follow-up, PEG led to greater hematocrit control and greater platelet control in patients with PV. In contrast, HU produced a greater HPR; the authors stated the possibility of a dose dependent effect driving this result with higher HU doses associated with greater HPR.
The limitations highlighted included a premature study closure before reaching an accrual of 300 patients which impacted longer term evaluation. Also, HPR evaluation did not have a review by a central review committee, therefore limiting the impact of these findings. Finally, study dosing for both agents may differ from real-world, thus reducing the translatability of the efficacy and tolerability findings.
References
Please indicate your level of agreement with the following statements:
The content was clear and easy to understand
The content addressed the learning objectives
The content was relevant to my practice
I will change my clinical practice as a result of this content

