All content on this site is intended for healthcare professionals only. By acknowledging this message and accessing the information on this website you are confirming that you are a Healthcare Professional. If you are a patient or carer, please visit the MPN Advocates Network.
The mpn Hub website uses a third-party service provided by Google that dynamically translates web content. Translations are machine generated, so may not be an exact or complete translation, and the mpn Hub cannot guarantee the accuracy of translated content. The mpn and its employees will not be liable for any direct, indirect, or consequential damages (even if foreseeable) resulting from use of the Google Translate feature. For further support with Google Translate, visit Google Translate Help.
The MPN Hub is an independent medical education platform, sponsored by AOP Health, GSK, Sumitomo Pharma, and supported through educational grants from Bristol Myers Squibb and Incyte. Funders are allowed no direct influence on our content. The levels of sponsorship listed are reflective of the amount of funding given. View funders.
Now you can support HCPs in making informed decisions for their patients
Your contribution helps us continuously deliver expertly curated content to HCPs worldwide. You will also have the opportunity to make a content suggestion for consideration and receive updates on the impact contributions are making to our content.
Find out more
Create an account and access these new features:
Bookmark content to read later
Select your specific areas of interest
View MPN content recommended for you
DRSS: A new disease risk stratification system for hematologic malignancies
The success of allogeneic hematopoietic stem cell transplantation (allo-HSCT) is largely dependent upon disease type and remission status before transplant. Evaluating allo-HSCT outcomes is therefore challenging, as studies often include patients with a range of hematologic malignancies.
To facilitate the analysis of heterogeneous populations of patients undergoing transplant, Roni Shouval and colleagues have developed a new disease risk stratification system (DRSS) based on disease type, remission status, and genetic factors.1 Their study results, published in The Lancet Haematology, are summarized below.
Study design
Development and internal validation of the DRSS was performed on a total of 47,265 adult allo-HSCT recipients with hematologic malignancies, reported to the European Society for Blood and Marrow Transplantation (EBMT) registry between January 1, 2012 and December 31, 2016. The patients were separated into three cohorts:
- Derivation cohort (n = 25,534), to develop the model
- Patients were stratified for overall survival (OS) according to a total of 55 disease and remission status combinations in a multivariable Cox model
- Acute myeloid leukemia (AML) was classified as de novo or secondary, and de novo patients were further stratified by FLT3-ITD and NPM1 mutation status
- Myelodysplastic syndromes (MDS) were stratified by adverse cytogenetic risk (complex karyotype or chromosome 7 deletion/monosomy)
- Patients with acute lymphoblastic leukemia (ALL) were stratified by Philadelphia chromosome status
- Tuning cohort (n = 18,365), to evaluate various risk groupings identified in the derivation cohort
- Geographical validation cohort (n = 3,366), to test the selected risk stratification scheme
External validation was performed on an independent cohort of 660 patients at a single US institution.
Results
Selected patient characteristics are shown in Table 1.
- The predominant indication for allo-HSCT was AML, accounting for nearly half of all transplants, followed by ALL and MDS.
- Bone marrow grafts, haploidentical donors, and myeloablative conditioning were more common in the geographical validation cohort than in the derivation and tuning cohorts.
- Median follow-up was 2.1 years, 4.6 years, and 3.0 years; and completeness of follow-up at 2 years was 72.7%, 83.8%, and 94.8% for the derivation, tuning, and geographical validation cohorts, respectively.
Table 1. Patient characteristics*
|
ALL, acute lymphoblastic leukemia; AML, acute myeloid leukemia; CLL, chronic lymphocytic leukemia; IQR, interquartile range; MDS, myelodysplastic syndromes; MPN, myeloproliferative neoplasms. |
|||
|
|
Derivation cohort |
Tuning cohort |
Geographical validation cohort |
|---|---|---|---|
|
Median age, years (IQR) |
53 (41–62) |
51 (39–60) |
52 (40–60) |
|
Male gender, % |
58.8 |
59.0 |
56.8 |
|
Karnofsky performance status, % |
|
|
|
|
Diagnosis, % |
|
|
|
|
Cell source, % |
|
|
|
|
Donor, % |
|
|
|
|
Conditioning intensity, % |
|
|
|
DRSS development and internal validation
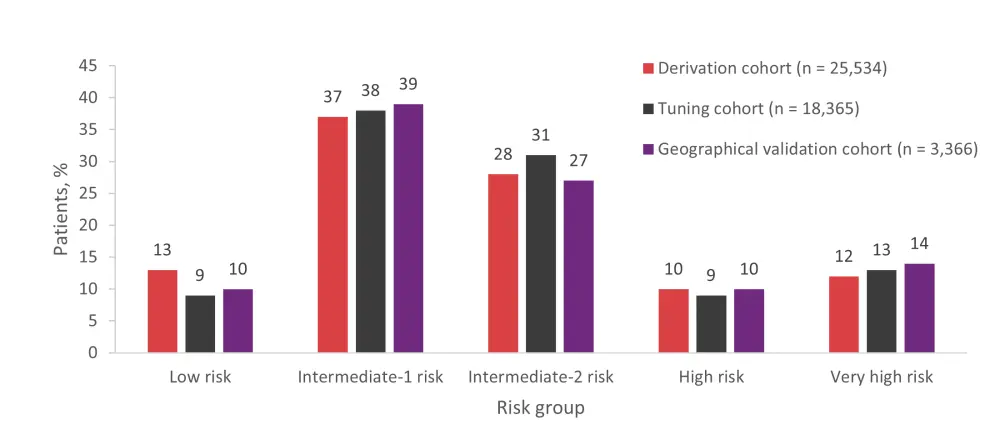
- The proposed DRSS comprised five risk groups: low, intermediate-1, intermediate-2, high, and very high. The distribution of patients in each risk group was similar for the derivation, tuning, and geographical validation cohorts (Figure 1).
Figure 1. Distribution of patients across DRSS risk groups by population cohort*

*Data from Shouval et al.1
- Across all cohorts, DRSS was the most important determinant for OS; risk levels were independently associated with an increase in the hazard ratio for OS, which corresponded with lower 2-year OS rates (Table 2).
- The DRSS remained an independent predictor of survival for the geographical validation cohort when adjusting for in vivo T-cell depletion.
Table 2. Unadjusted 2-year OS rates and hazard ratios for OS by DRSS risk group*
|
HR, hazard ratio; OS, overall survival; ref, reference. |
||||||
|
|
Derivation cohort |
Tuning cohort |
Geographical validation cohort |
|||
|---|---|---|---|---|---|---|
|
2-year OS, % |
HR |
2-year OS, % |
HR |
2-year OS, % |
HR |
|
|
Low risk |
72.4 |
1 (ref) |
72.2 |
1 (ref) |
76.3 |
1 (ref) |
|
Intermediate-1 risk |
64.1 |
1.26 |
64.4 |
1.25 |
66.3 |
1.48 |
|
Intermediate-2 risk |
57.6 |
1.53 |
57.7 |
1.52 |
60.8 |
1.62 |
|
High risk |
47.6 |
2.03 |
47.3 |
2.04 |
48.6 |
2.61 |
|
Very high risk |
36.2 |
2.87 |
33.6 |
2.90 |
32.1 |
3.70 |
External validation
- There was no difference in survival between low risk and intermediate-1 risk groups in the external validation cohort, so these two groups were combined.
- The 2-year OS rates for the modified DRSS were 66.6%, 55.4%, 40.4%, and 34.8% for the low/intermediate-1, intermediate-2, high, and very high-risk groups, respectively.
Comparison with the Disease Risk Index
- Stratification by the DRSS was compared with the revised Disease Risk Index (DRI) using time-dependent area under the receiver operating characteristic curve (AUC) statistic.
- The DRSS had a slightly higher AUC for 2-year OS than the DRI (61.0 vs 58.9 in the derivation cohort, 61.6 vs 59.3 in the tuning cohort, 63.3 vs 62.0 in the geographic validation cohort, and 61.6 vs 60.9 in the external validation cohort).
- Across cohorts, most patients were classified as intermediate risk by the DRI (65% in the derivation, tuning, and external validation cohorts and 64% in the internal geographic validation cohort).
- Corresponding 2-year OS estimates were 62.5% for the derivation cohort, 61.5% for the tuning cohort, and 64.8% for both the internal and external validation cohorts.
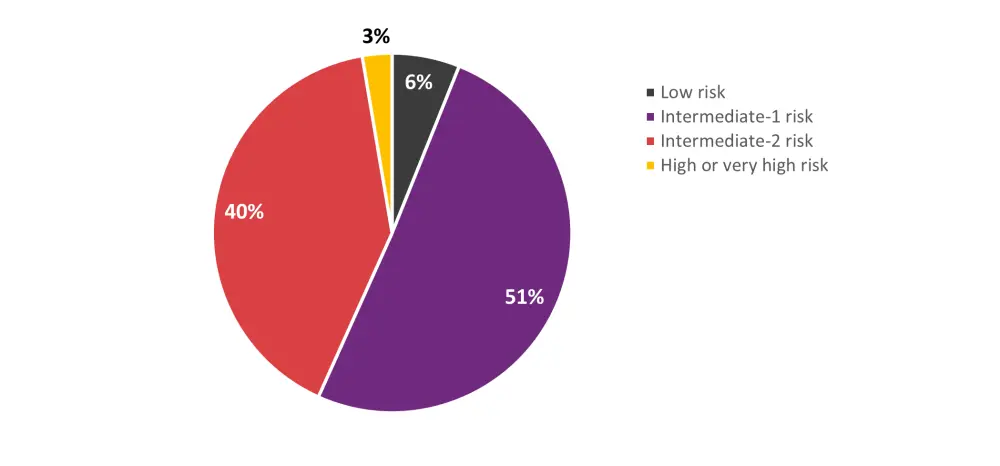
- In a sub analysis combining the tuning and geographic validation cohorts, intermediate-risk patients according to the DRI were reclassified by the DRSS as shown in Figure 2.
- These groups had distinct survival trajectories; estimated 2-year OS rates were 73.1%, 64.4%, 58.5%, 45.5%, and 45.7% for the low risk, intermediate-1 risk, intermediate-2 risk, high risk, and very high-risk groups (p<0.0001).
Figure 2. Reclassification of DRI intermediate-risk patients according to the DRSS*

DRI, Disease Risk Index; DRSS, disease risk stratification system.
*Data from Shouval et al.1
Summary
The DRSS is a new risk stratification model for hematologic malignancies that builds upon the revised DRI model. It is anticipated that this system will aid the interpretation of studies with heterogeneous populations of patients and promote the design of clinical trials that incorporate mixed transplant indications.
References
Please indicate your level of agreement with the following statements:
The content was clear and easy to understand
The content addressed the learning objectives
The content was relevant to my practice
I will change my clinical practice as a result of this content

