All content on this site is intended for healthcare professionals only. By acknowledging this message and accessing the information on this website you are confirming that you are a Healthcare Professional. If you are a patient or carer, please visit the MPN Advocates Network.
The mpn Hub website uses a third-party service provided by Google that dynamically translates web content. Translations are machine generated, so may not be an exact or complete translation, and the mpn Hub cannot guarantee the accuracy of translated content. The mpn and its employees will not be liable for any direct, indirect, or consequential damages (even if foreseeable) resulting from use of the Google Translate feature. For further support with Google Translate, visit Google Translate Help.
The MPN Hub is an independent medical education platform, sponsored by AOP Health, GSK, Sumitomo Pharma, and supported through educational grants from Bristol Myers Squibb and Incyte. Funders are allowed no direct influence on our content. The levels of sponsorship listed are reflective of the amount of funding given. View funders.
Now you can support HCPs in making informed decisions for their patients
Your contribution helps us continuously deliver expertly curated content to HCPs worldwide. You will also have the opportunity to make a content suggestion for consideration and receive updates on the impact contributions are making to our content.
Find out more
Create an account and access these new features:
Bookmark content to read later
Select your specific areas of interest
View MPN content recommended for you
SHIP: Red cell distribution width as a predictor of thromboembolic complications
Thromboembolic complications are a high risk for patients with myeloproliferative neoplasms (MPN), yet prognostic parameters for increased risk are currently lacking.1 Previously, a study identified risk factors for patients with polycythemia vera for clinical prediction of thromboembolic events.2
The MPN Hub has also reported on the risk of thrombosis in patients with secondary myelofibrosis.3 Below, the MPN Hub summarizes a new analysis investigating the predictive value of these parameters in a normal (individuals without myeloproliferation or hematopoietic cancers) control population in order to validate these findings.1
Study design
This analysis was conducted in two independent cohorts of patients from the Study of Health in Pomerania (SHIP). In total, 2,491 patients were assessed between 1997 and 2001, and 4,358 patients were assessed between 2008 and 2011.1 Baseline characteristics of established risk factors for thromboembolic events are summarized in Table 1. Receiver operating characteristic curves were calculated to assess the predictive value of the model.1
Table 1. Baseline characteristics*
|
BMI, body mass index; RDW, red cell distribution width; SHIP, Study of Health in Pomerania. |
||
|
Baseline characteristic (%, unless otherwise stated) |
SHIP-START-0 |
SHIP-TREND-0 |
|---|---|---|
|
Male |
49.5 |
48.5 |
|
Age (range) |
20–81 |
20–84 |
|
BMI (kg/m2) |
27.1 |
27.5 |
|
Hypercholesterolemia |
26.4 |
21.2 |
|
Hypertension |
40.9 |
48.0 |
|
Diabetes mellitus |
8.0 |
10.4 |
|
RDW |
12.4 |
13.1 |
|
Hematocrit |
39.9 |
41.8 |
Results
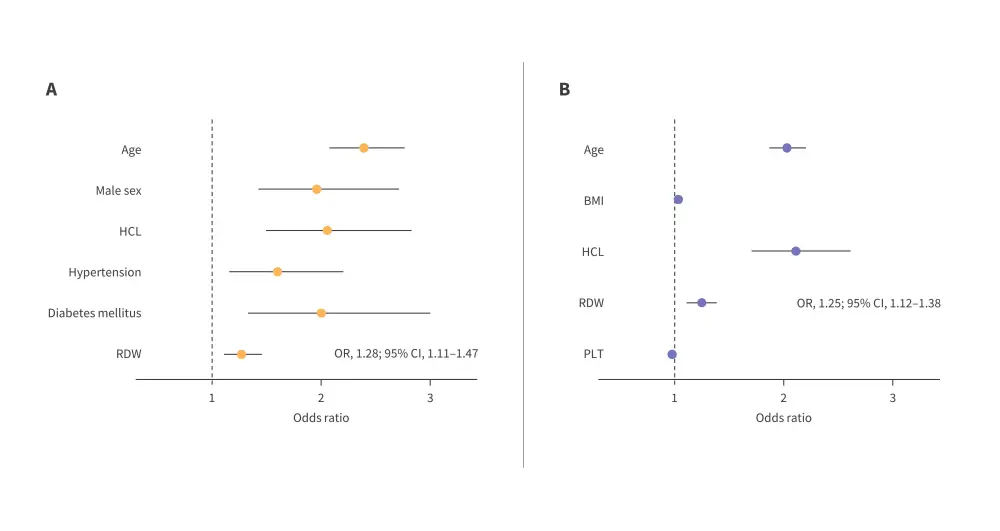
In both cohorts, age, hypercholesterolemia and red cell distribution width (RDW) were identified as predictors of thromboembolic events.1 Thromboembolic events had occurred in 12.9% of individuals in the SHIP-START cohort and 21.4% of the SHIP-TREND cohort, and confirmed risk factors were as follows:1
- In the SHIP-TREND cohort, increased age, hypercholesterolemia, and elevated body mass index scored as predictive factors for risk of thromboembolism (Figure 1A).
- In the SHIP-START cohort, male sex and diabetes mellitus were also scored as predictive factors for risk of thromboembolism (Figure 1B).
- In both cohorts, age, hypercholesterolemia, and RDW were confirmed as predictors of thromboembolic events.
- RDW with an odds ratio of 1.28 (95% confidence interval [CI], 1.11–1.47) in the SHIP-START cohort and 1.25 (95% CI, 1.12–1.38) in the SHIP-TREND cohort.
Figure 1. A. SHIP-START-0 final model odds ratios. B. SHIP-TREND-0 final model odds ratios*

*Adapted from Manz, et al.1
BMI, body mass index; CI, confidence interval; HCL, hypercholesterolemia; OR, odds ratio; PLT, platelet; RDW, red cell distribution width.
Conclusion
These results confirm that RDW could be used as an independent predictive parameter for thromboembolic evets in the general population.1 Further validation of predictive scoring systems combining predictive laboratory parameters are required, but this study confirms this would be worth investigating; with model accuracy rates of 89.2% and 86.8% for the SHIP-START and SHIP-TREND cohorts respectively.1
References
Please indicate your level of agreement with the following statements:
The content was clear and easy to understand
The content addressed the learning objectives
The content was relevant to my practice
I will change my clinical practice as a result of this content


