All content on this site is intended for healthcare professionals only. By acknowledging this message and accessing the information on this website you are confirming that you are a Healthcare Professional. If you are a patient or carer, please visit the MPN Advocates Network.
The mpn Hub website uses a third-party service provided by Google that dynamically translates web content. Translations are machine generated, so may not be an exact or complete translation, and the mpn Hub cannot guarantee the accuracy of translated content. The mpn and its employees will not be liable for any direct, indirect, or consequential damages (even if foreseeable) resulting from use of the Google Translate feature. For further support with Google Translate, visit Google Translate Help.
The MPN Hub is an independent medical education platform, sponsored by AOP Health, GSK, Sumitomo Pharma, and supported through educational grants from Bristol Myers Squibb and Incyte. Funders are allowed no direct influence on our content. The levels of sponsorship listed are reflective of the amount of funding given. View funders.
Now you can support HCPs in making informed decisions for their patients
Your contribution helps us continuously deliver expertly curated content to HCPs worldwide. You will also have the opportunity to make a content suggestion for consideration and receive updates on the impact contributions are making to our content.
Find out more
Create an account and access these new features:
Bookmark content to read later
Select your specific areas of interest
View MPN content recommended for you
Disease characteristics and outcomes in pediatric and young adult patients with MPN
Pediatric or young adult (PAYA) patients diagnosed with myeloproliferative neoplasms (MPN), defined as those ≤40 years old, represent a significant proportion of overall MPN cases; however, this group is associated with unique clinical presentations and outcomes. While it is unclear whether mortality is higher in pediatric/young adult patients compared with older patients, optimal clinical management remains poorly defined.1
In response to this, Harris et al.1 published a paper in British Journal of Hematology investigating the disease characteristics and outcomes of young adult and pediatric patients diagnosed with MPN. Below, we summarize the key findings
Study design
In total, 630 patients who were included in an MPN registry between 2005 and 2015 were investigated. This population was further subcategorized into PAYA, if <40 years old at diagnosis, and older adult (OA), if ≥40 years old at diagnosis. Diagnosis of either essential thrombocythemia (ET), polycythemia vera (PV), or myelofibrosis (MF) was confirmed across the entire cohort retrospectively. Any patients with a secondary cause of erythrocytosis or thrombocytosis were excluded.
Disease phenotype
A total of 171 patients were categorized as PAYA and 459 patients were categorized as OA. The full list of patient characteristics is shown in Table 1.
Table 1. Patient characteristics*
|
ET, essential thrombocytosis; MF, myelofibrosis; MPN, myeloproliferative neoplasms; OA, older adult; PAYA, pediatric and young adult; PV, polycythemia vera. |
|||
|
Characteristic |
PAYA |
OA |
p value |
|---|---|---|---|
|
Female, % |
70.8 |
57.5 |
0.002 |
|
Mean age at diagnosis (range), years |
31 (0–39) |
58 (40–89) |
<0.001 |
|
Phenotype at diagnosis, % |
|
|
|
|
ET |
66.7 |
38.6 |
<0.001 |
|
PV |
26.3 |
45.3 |
<0.001 |
|
MF |
7.0 |
16.1 |
0.003 |
|
Familial MPN† |
19.0 |
9.0 |
0.002 |
|
Diagnosis of ET |
PAYA (n = 114) |
OA (n = 177) |
|
|
Mean age at diagnosis (range), |
30 (0–39) |
52 (40–89) |
<0.001 |
|
Diagnosis of MF |
PAYA (n = 49) |
OA (n = 209) |
|
|
Mean age at diagnosis (range), |
33 (25–39) |
61 (42–90) |
<0.001 |
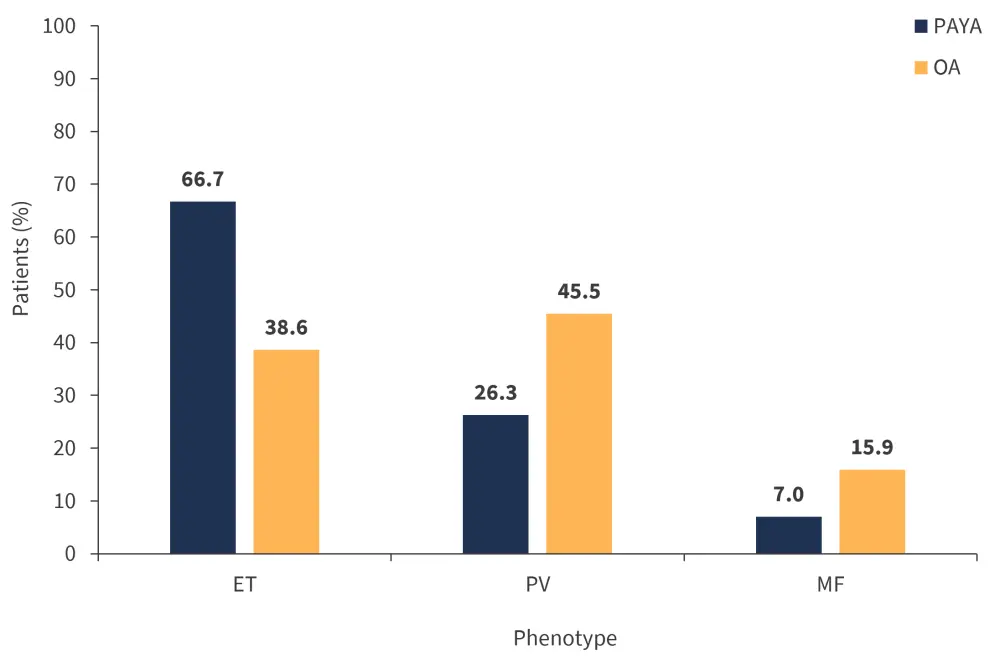
Phenotypes differed significantly between the two groups, with ET more common in the PAYA group (p < 0.001) and PV (p < 0.001) and MF (p < 0.01) more frequent in the OA group (Figure 1).
Figure 1. Percentage of patients with each disease phenotype*

ET, essential thrombocythemia; MF, myelofibrosis; OA, older adult; PAYA, pediatric and young adult; PV, polycythemia vera.
*Adapted from Harris, et al.1
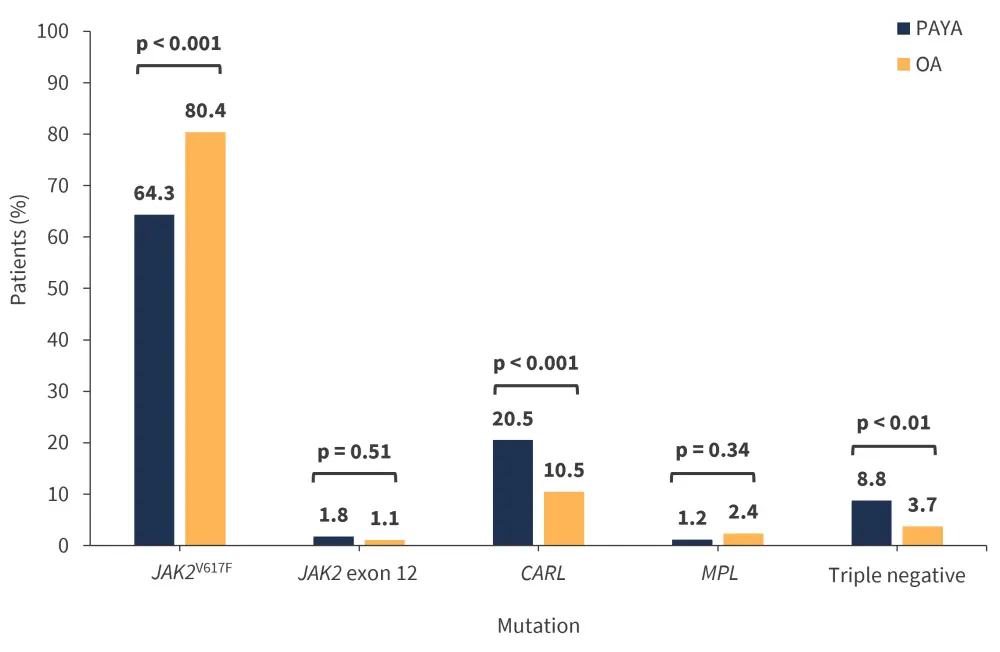
The difference in JAK2V617F, CALR, and triple-negative mutations was also significant between the PAYA and OA groups (Figure 2). Interestingly, all patients diagnosed with PV in both the PAYA and OA groups had a JAK2 mutation; however, this was less common in those diagnosed with ET in the PAYA group (55.3%) compared with patients with ET in the OA group (66.7%; p = 0.05). The frequency of CALR mutations was similar in patients diagnosed with ET but more common in those diagnosed with MF in the PAYA group. Moreover, the frequency of MPL mutations was similar across both patient groups regardless of phenotype; however, it was found to be slightly higher in patients with ET in the OA group.
Figure 2. Percentage of patients with each somatic driver mutation*

OA, older adult; PAYA, pediatric and young adult.
*Adapted from Harris, et al.1
Clinical outcomes
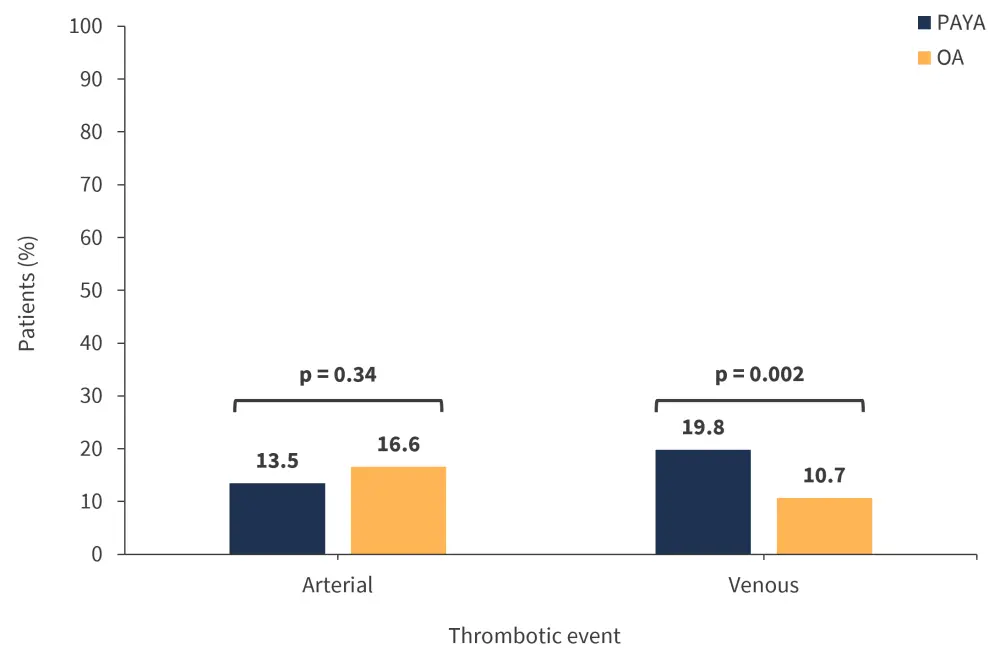
The rates of venous and arterial thrombotic events are shown in Figure 3. Splanchnic vein thrombosis was more common in the PAYA group at 11.7% compared with 4.6% in the OA group (p = 0.001). In contrast, the most common arterial event was transient ischemic attack/cerebrovascular accident, with a significantly higher rate in the OA group compared with the PAYA group (11.8% vs 5.8%, respectively; p = 0.03). Univariate analysis further revealed that JAK2 mutations were a significant risk factor for arterial and venous thrombosis in PAYA patients.
Figure 3. Rate of venous and arterial thrombotic events*

OA, older adult; PAYA, pediatric and young adult.
*Adapted from Harris, et al.1
Disease progression
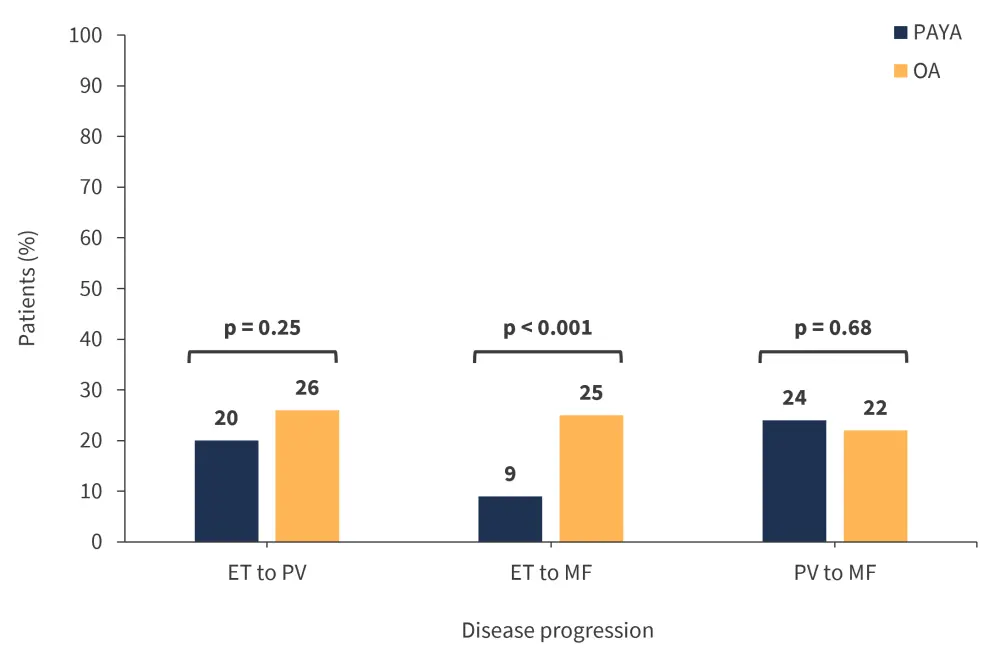
The rates of disease progression from ET to MF were significantly different between the PAYA and OA patient groups (Figure 4), while the duration to secondary diagnosis was longer for each phenotype progression in the PAYA group compared with the OA group (Table 2).
Figure 4. Rates of disease progression*

ET, essential thrombocythemia; MF, myelofibrosis; OA, older adult; PAYA, pediatric and young adult; PV, polycythemia vera.
*Adapted from Harris, et al.1
Table 2. Mean duration of progression to secondary diagnosis*
|
ET, essential thrombocythemia; MF, myelofibrosis; OA, older adult; PAYA, pediatric and young adult; |
||
|
Phenotype progression |
PAYA |
OA |
|---|---|---|
|
ET to PV, years |
10 |
8 |
|
ET to MF, years |
22 |
12 |
|
PV to MF, years |
24 |
10 |
Secondary cancers
The overall frequency of secondary cancers in PAYA patients was significantly decreased at 9.9% compared with 23.1% in OA patients (p < 0.001). Genitourinary cancers were more frequent in the PAYA group at 29.4% compared with 7.5% for patients in the OA group (p = 0.007). There was an increased incidence of melanoma in the OA and PAYA groups (29.4% and 12.5%); however, this difference was not significant.
Overall survival
In the OA group, median overall survival was 13 years (range, 1–36 years) compared with not reached in the PAYA group (range, 3–59 years). There were also fewer deaths in the PAYA group compared with the OA group (19 vs 146; p < 0.001).
Familial MPN
Interestingly, around 10% of patients in the PAYA group showed familial clustering; potentially, this indicates a heritable component of disease development. Harris et al.1 hypothesized that the frequency of familial MPN would be greater among patients in the PAYA group compared with the OA group, due to the contribution of germline variants. This was reinforced by the fact that 19% of patients from the PAYA group had a first or second degree relative with MPN compared with only 9% of patients in the OA group (p = 0.002).
Conclusion
Overall, PAYA patients who present with ET at diagnosis are the least likely to possess a JAK2 mutation compared with OA patients. In contrast, PAYA patients are at higher risk for venous thrombotic events compared with OA patients but experience a slower rate and reduced frequency of disease transformation.
Limitations of the study include its retrospective nature and data having been generated from only one institution, thus hindering potential generalizability. Patient analysis was also performed over a period of 10 years, with treatment options and clinical management changing significantly in that time; this was not accounted for in the study.
References
Please indicate your level of agreement with the following statements:
The content was clear and easy to understand
The content addressed the learning objectives
The content was relevant to my practice
I will change my clinical practice as a result of this content

