All content on this site is intended for healthcare professionals only. By acknowledging this message and accessing the information on this website you are confirming that you are a healthcare professional. If you are a patient or carer, please visit the MPN Advocates Network.
The MPN Hub website uses a third-party service provided by Google that dynamically translates web content. Translations are machine generated, so may not be an exact or complete translation, and the MPN Hub cannot guarantee the accuracy of translated content. The MPN Hub and its employees will not be liable for any direct, indirect, or consequential damages (even if foreseeable) resulting from use of the Google Translate feature. For further support with Google Translate, visit Google Translate Help.


The MPN Hub is an independent medical education platform, sponsored by GSK, Novartis, AOP, Sobi and Takeda and supported through independent educational grants from Bristol Myers Squibb, Blueprint, Incyte and Merck Sharp & Dohme LLC, Rahway, NJ, USA. Funders are allowed no direct influence on our content. The levels of sponsorship listed are reflective of the amount of funding given. View funders.
Now you can support HCPs in making informed decisions for their patients
Your contribution helps us continuously deliver expertly curated content to HCPs worldwide. You will also have the opportunity to make a content suggestion for consideration and receive updates on the impact contributions are making to our content.
Find out more
Create an account to access:
Bookmark & personalize site content
Receive alerts for new content in your areas of interest
View MPN content recommended for you
PV: Real-world patient characteristics and treatment patterns in Taiwan
Polycythemia vera (PV) is a classical Philadelphia-negative, chronic myeloproliferative neoplasm clinically characterized by primary erythrocytosis and subsequent hypervolemia, hyperviscosity, thrombocytosis, and leukocytosis. It is also associated with the risk of thromboembolism, progression to myelofibrosis, and transformation to acute myeloid leukemia.
Patients with PV can be stratified into low- and high-risk subgroups based on age and history of thrombosis; classification and treatment recommendations for each risk category are summarized in Figure 1. Although treatment options for PV are limited in Taiwan, the most common treatment approaches include aspirin, phlebotomy, and hydroxyurea (HU).
The MPN Hub previously reported on the overall treatment goals for patients with PV. Below, we summarize an article published by Tsai et al. in Therapeutic Advances in Hematology,1 on patient characteristics and phlebotomy and HU treatment patterns of patients with PV in Taiwan.
Figure 1. Classification and treatment recommendations for low- and high-risk PV*

HU, hydroxyurea; PV, polycythemia vera.
*Data from Tsai, et al.1
Study methods
- Nationwide, cross-sectional study that identified patients with PV from the National Health Insurance Research Database in Taiwan (NHIRD) between 2016 and 2017.
- Retrospective data also retrieved from 2001 to 2017.
- Investigated several demographic variables and treatment patterns overall, by sex and by risk group.
- Demographic variables examined included: age at diagnosis, age at enrollment, duration of disease, history of thrombosis prior to diagnosis, occurrence of thrombosis since diagnosis, and history of bone marrow aspirate/biopsy, comorbidities such as type 2 diabetes, hypertension, hyperlipidemia, hepatitis B/C, ischemic heart disease, chronic kidney disease, and splenomegaly.
- Treatment patterns studied were the annualized frequency of phlebotomy and daily dose of HU received during 2016 and 2017, as well as treatment duration between 2001 and 2017.
Results
Patient characteristics
- In total, 2,647 patients were enrolled; 1,288 of whom were low-risk and 1,359 who were high-risk.
- The prevalence rate was approximately 10.8 cases per 100,000 people; and the estimated incidence rates in 2016 and 2017 were 2.41 and 2.65 cases per 100,000 people, respectively.
- There was a significantly higher occurrence of thrombosis between 2016 and 2017 and a higher number of reported deaths in the high- versus low-risk subgroup. Patient characteristics between 2016 and 2017 by risk group are summarized in Table 1.
Table 1. Patient characteristics*
|
BM, bone marrow; Q1, lower quartile; Q3, higher quartile; SD, standard deviation. |
|||||
|
Characteristic, |
<60 years with no history of thrombosis (n = 1,288) |
<60 years with history of thrombosis (n = 101) |
≥60 years with no history of thrombosis (n = 1,107) |
≥60 years with history of thrombosis (n = 151) |
Low vs high risk† p value |
|---|---|---|---|---|---|
|
Sex |
|
|
|
|
<0.0001 |
|
Male |
75.7 |
74.3 |
63.5 |
57.6 |
|
|
Female |
24.3 |
25.3 |
36.5 |
42.4 |
|
|
Age at diagnosis |
|
|
|
|
<0.0001 |
|
Mean (SD) |
41.7 (11.8) |
47.4 (8.8) |
65.7 (8.8) |
66.8 (8.5) |
|
|
Median (Q1–Q3) |
43 (35–51) |
49 (42–54) |
65 (60–71) |
67 (61–72) |
|
|
Age during 2016–2017 |
|
|
|
|
<0.0001 |
|
Mean (SD) |
44.0 (12.1) |
50.9 (8.6) |
70.4 (7.9) |
72.0 (8.1) |
|
|
Median (Q1–Q3) |
46.0 (38–54) |
54.0 (47–57) |
69.0 (64–76) |
72.0 (65–77) |
|
|
BM aspiration at diagnosis |
|
|
|
|
<0.0001 |
|
Yes |
15.8 |
22.8 |
25.7 |
22.5 |
|
|
Comorbidities |
|
|
|
|
|
|
Diabetes |
19.5 |
29.7 |
36.3 |
31.8 |
<0.0001 |
|
Hypertension |
47.0 |
68.3 |
78.8 |
80.8 |
<0.0001 |
|
Hyperlipidemia |
45.6 |
53.5 |
52.3 |
60.3 |
0.0012 |
|
Hepatitis B |
10.7 |
12.9 |
8.3 |
6.0 |
0.0416 |
|
Hepatitis C |
2.0 |
5.9 |
2.6 |
4.0 |
0.1022 |
|
Ischemic heart disease |
17.5 |
26.7 |
40.6 |
50.3 |
<0.0001 |
|
Chronic kidney disease |
7.5 |
14.9 |
18.2 |
22.5 |
<0.0001 |
|
Splenomegaly |
3.0 |
4.0 |
4.0 |
2.0 |
0.3037 |
|
Thrombosis (2016–2017) |
0.62 |
27.7 |
1.8 |
30.5 |
<0.0001 |
|
Disease progression |
|
|
|
|
|
|
Myelofibrosis |
0.5 |
0 |
0.7 |
1.3 |
0.5358 |
|
Acute myeloid leukemia |
0.3 |
0 |
0.6 |
0 |
0.4136 |
|
Death |
1.6 |
1.0 |
7.9 |
9.9 |
<0.0001 |
Treatment patterns
Of the 2,647 evaluable patients, 647 received phlebotomy and 489 received HU treatment; 528 (19.9%) received both phlebotomy and HU, and the remaining 983 received neither treatment. Both male and female patients who received phlebotomy only were younger than those receiving only HU or combined therapy. The type of treatment varied between sexes and between risk groups from 2016 and 2017 (Figure 2).
Figure 2. Treatment patterns of phlebotomy and HU (A) by risk groups and (B) by sex*
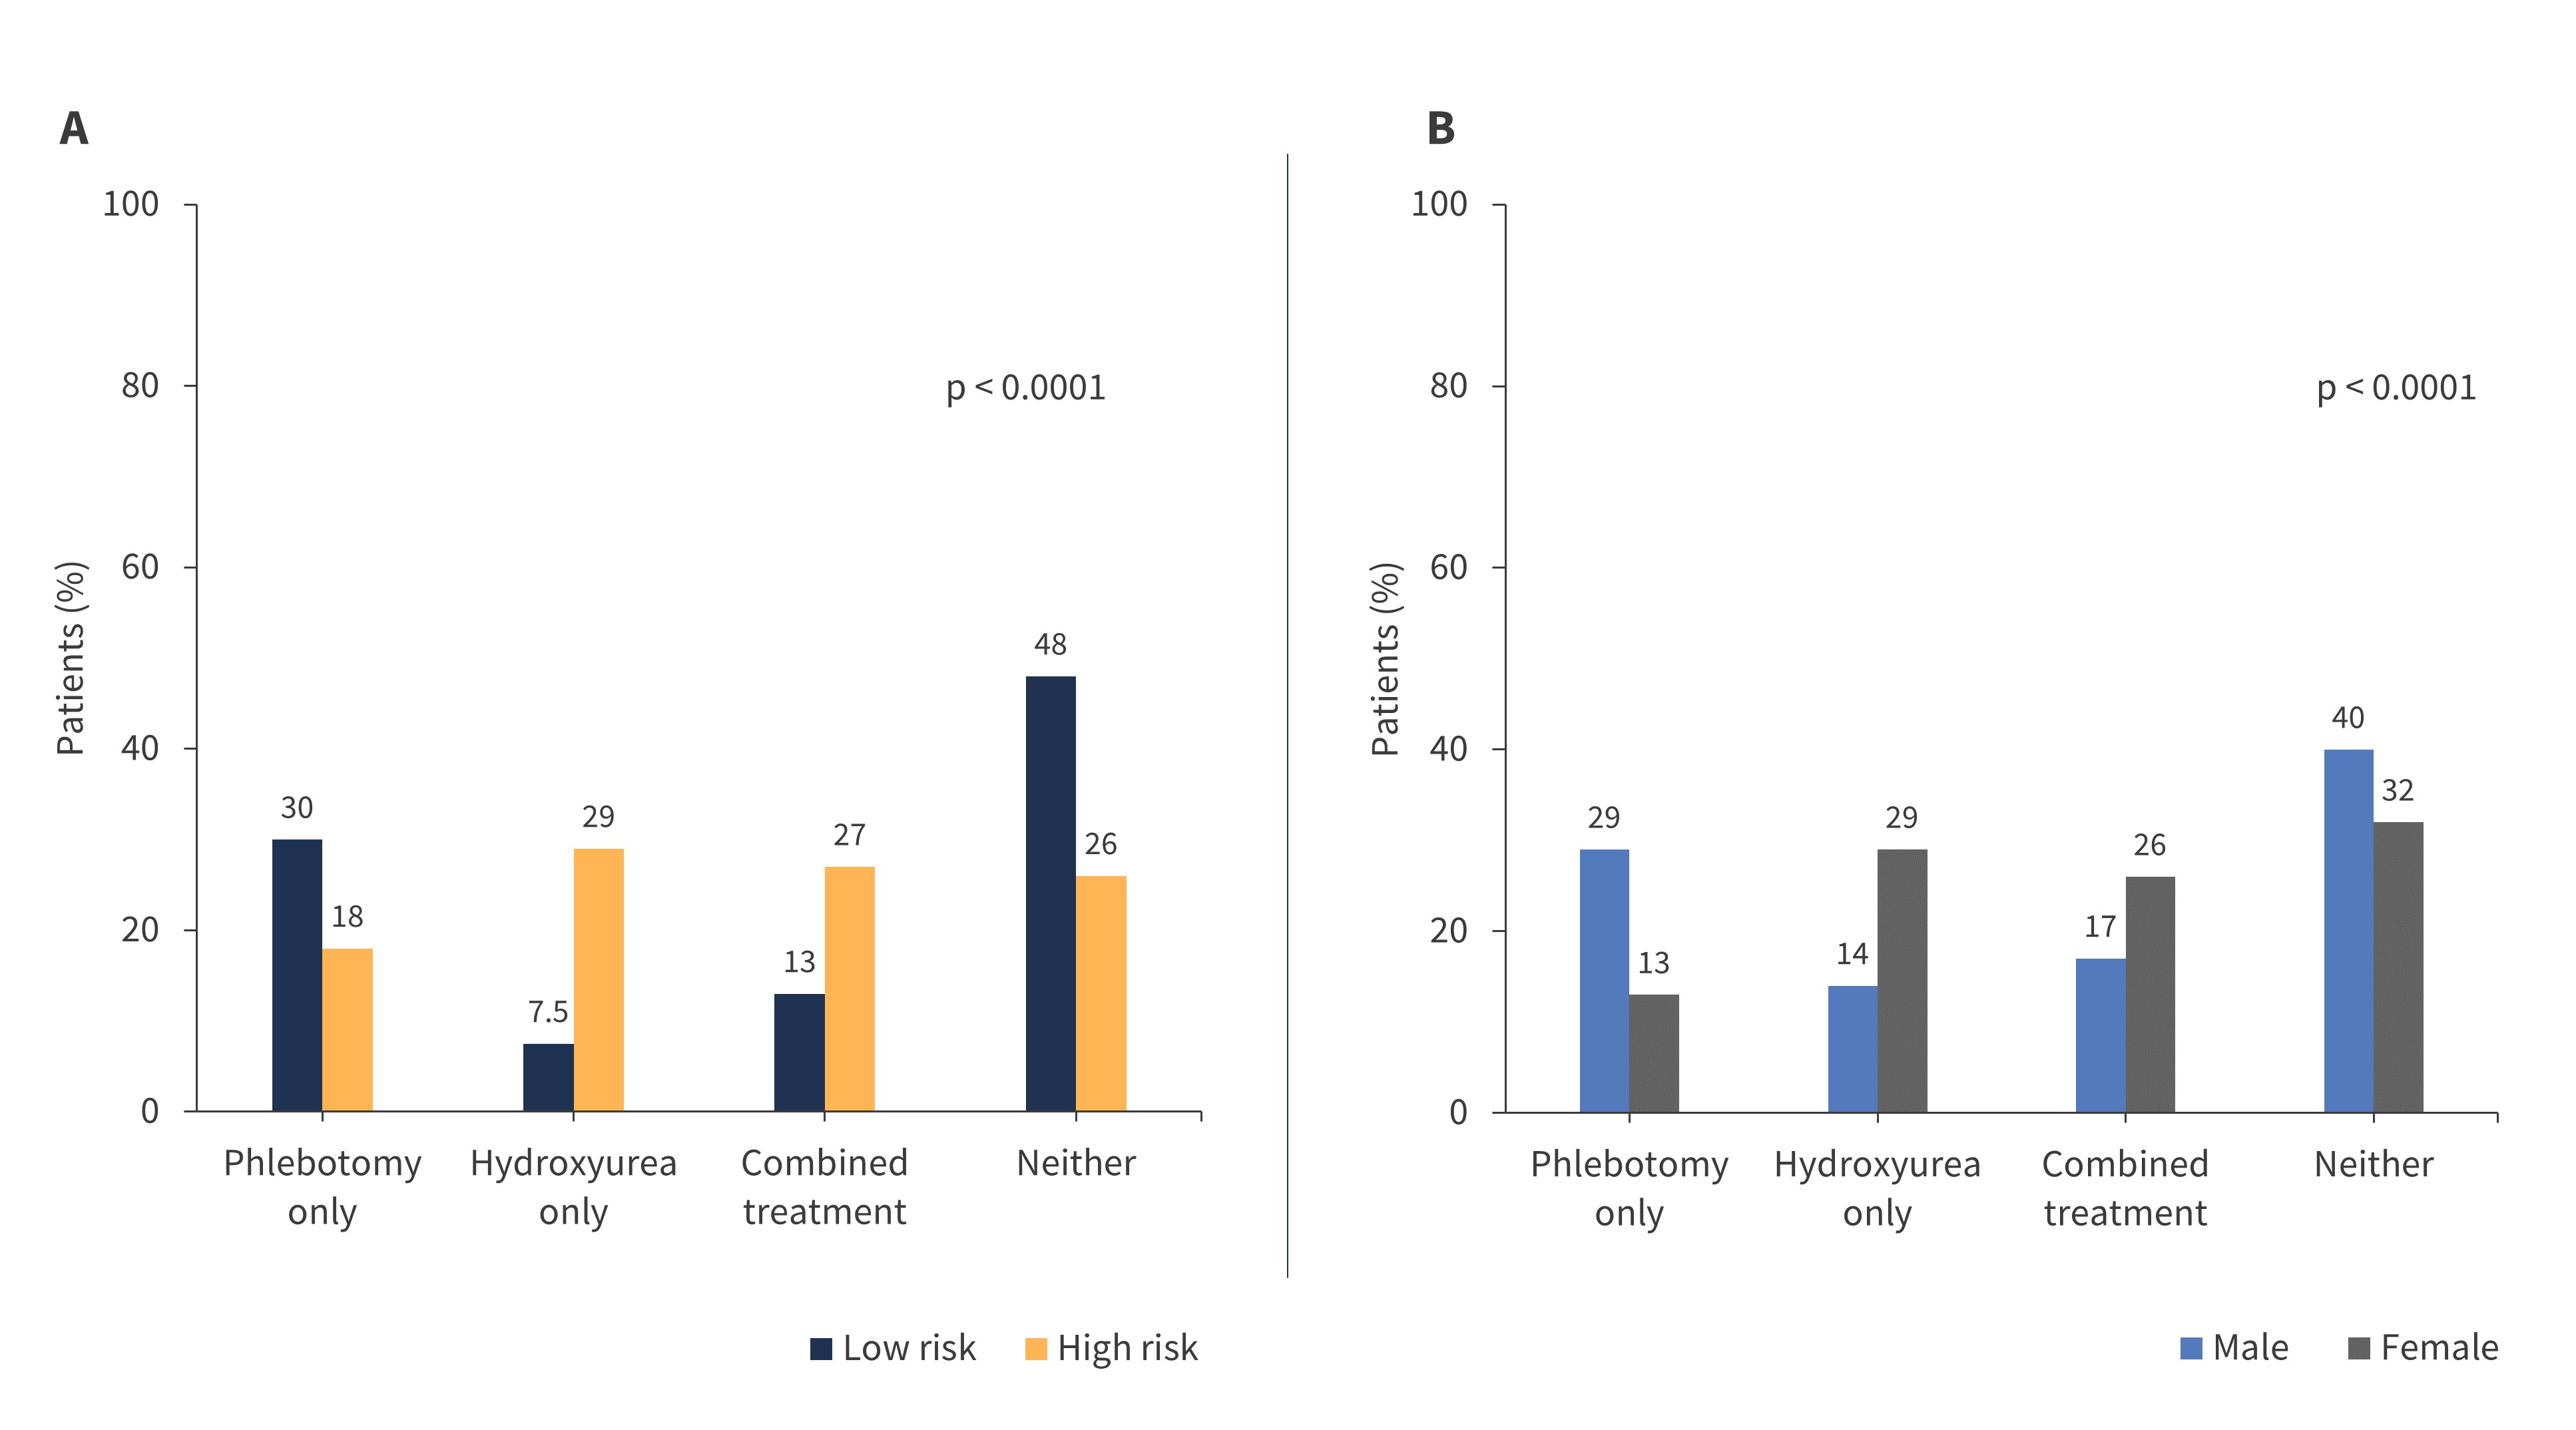
HU, hydroxyurea.
*Data from Tsai.1
In the retrospective analysis between 2001 and 2017, 1,504 patients received phlebotomy with a median duration of 3.4 years, and a total of 1,080 patients received HU treatment with a median duration of 4.6 years; the duration of HU was significantly longer in high-risk versus low-risk patients (p < 0.0001). In the 365-day period between 2016 and 2017, 1,162 patients and 663 patients received annualized frequency of phlebotomy and an average daily dose of HU, respectively; treatment patterns are summarized in Table 2.
Table 2. Annualized frequency of phlebotomy and average daily dose of HU in a 365-day period*
|
HU, hydroxyurea; Q1, lower quartile; Q3, higher quartile; SD, standard deviation. |
||||||
|
Characteristic, |
Male |
Female |
p value |
Low risk† |
High risk† |
p value |
|---|---|---|---|---|---|---|
|
Annualized phlebotomy frequency (N = 1,162) |
||||||
|
Patients overall, n |
797 |
365 |
|
497 |
665 |
|
|
With concurrent HU |
392 |
284 |
0.0017 |
192 |
484 |
0.1772 |
|
Mean ± SD |
3.0 ± 2.3 |
2.4 ± 1.8 |
|
2.9 ± 2.1 |
2.7 ± 2.2 |
|
|
Median (min-max) |
2 (1–13) |
2 (1–10) |
|
2 (1–11) |
2 (1–13) |
|
|
Without HU |
405 |
81 |
0.1224 |
305 |
181 |
0.3134 |
|
Mean ± SD |
3.2 ± 2.4 |
2.7 ± 1.6 |
|
3.0 ± 2.4 |
3.2 ± 2.2 |
|
|
Median (min–max) |
3 (1–15) |
3 (1–7) |
|
2 (1–15) |
3 (1–13) |
|
|
Averaged HU daily dose (N = 663) |
||||||
|
Patients overall |
353 |
310 |
|
163 |
500 |
|
|
With phlebotomy |
168 |
108 |
0.012 |
83 (50.9) |
193 |
0.002 |
|
Mean ± SD |
604.2 ± 315.3 |
516.5 ± 255.0 |
|
654.1 ± 321.3 |
533.6 ± 277.2 |
|
|
Median (Q1–Q3) |
519.7 (361.0–807.7) |
479.2 (322.0–673.6) |
|
637.8 (469.6–860.6) |
486.9 (343.4–701.9) |
|
|
Maximum |
2,000 |
1,470 |
|
2,000 |
1,470 |
|
|
Without phlebotomy |
|
|
|
|
|
0.02 |
|
Mean ± SD |
593.7 ± 286.1 |
539.6 ± 294.3 |
|
633.1 ± 325.1 |
547.9 ± 279.7 |
|
|
Median (Q1–Q3) |
526.9 (390.2–786.1) |
482.8 (321.8–701.6) |
|
582.4 (364.6–930.4) |
497.8 (336.8–699.0) |
|
|
Maximum |
1,367 |
1,481 |
|
1,411 |
1,481 |
|
The prevalence rates of PV in Taiwan were higher than in South Korea (10.9 cases vs 2.8–5.4 cases per 100,000), similar to Norway (10.9 vs 9.2 cases per 100,000), but lower than that in the United States (10.9 vs 22–57 cases per 100,000).
The mean age at diagnosis for patients with PV in Taiwan (53.4 years) was similar to other Asian populations, with a reported mean of 54.0 years and 53.7 years in China and South Korea, respectively. Conversely, the mean age of patients in Taiwan was younger when compared with Western populations, with an observed age at diagnosis of 64.3 years in Germany, 71.5 years in Canada, and 73 years in the United Kingdom.
Consistent with previous reports, there was a higher prevalence of male patients in this study, although the difference in proportion for this study (70:30) were greater than other populations: South Korea (60:40), Japan (57:43), China (54:46), Denmark (56:44), New Zealand (52:48), and the United States (58:42).
This study reported lower incidences of thrombotic events than those in an international study including patients from Austria, Italy, and the United States (2.2% is the overall incidence rate of thrombotic events in Taiwan versus 12% and 19% for postdiagnosis arterial and venous thrombosis, respectively, in a respective study). Additionally, this study reported higher mortality rates compared with the general population >60 years (4.1 vs 2.8 per 100 persons per year) – similar rates to the ECLAP study (NCT01645124) with 4.1 vs 3.2 per 100 persons per year, and lower rates than in Norway (4.1 vs 8.2 per 100 persons per year).
The distribution of phlebotomy treatment in low- and high-risk groups were lower compared with patients in the REVEAL study (NCT01252953), with 43.7% and 45.1% versus 70.4% and 53.4%, respectively. On the other hand, HU treatment in low- and high-risk groups were higher when compared with a US-based study (20.5% and 55.4% vs 18.9% and 42.0%), but lower when compared to the REVEAL study (20.5% and 55.4% vs 33.9% and 58.2%).
Conclusion
Overall, this analysis provided a real-world insight into the clinical landscape of patients with PV in Taiwan, including the distribution of patient characteristics and phlebotomy and hydroxyurea treatment patterns. Patient characteristics differed to Caucasian populations in previous studies, and similarities and differences were observed in treatment patterns – notably in prevalence, age at diagnosis, sex ratio, incidence of thrombosis and mortality when compared with other countries. This study provides rationale for further investigation into the genetics of PV among racial groups. Ultimately, a better understanding of patient characteristics and treatment patterns of PV across different regions will better inform clinical practice and improve patient outcomes.
References
Please indicate your level of agreement with the following statements:
The content was clear and easy to understand
The content addressed the learning objectives
The content was relevant to my practice
I will change my clinical practice as a result of this content


